IntelliBoard Encourages Faculty Intervention

IntelliBoard uses data visualization to display reports based on student Moodle data. The tool is accessed easily in Moodle and provides various reports to help you notice which students may need more support.
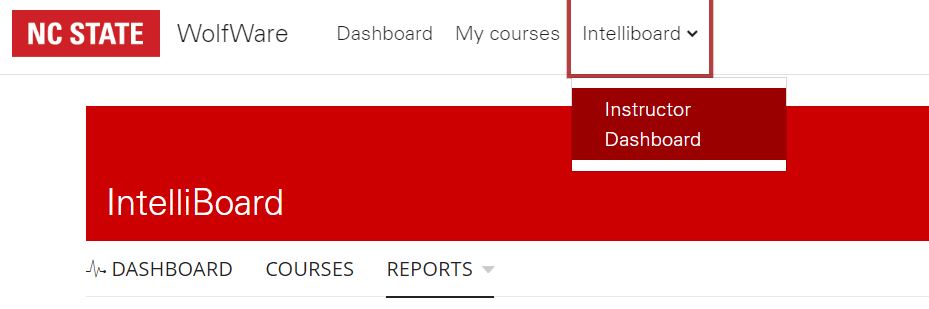
How to Access
To use IntelliBoard, log in to your Moodle course. At the top right of the menu, select IntelliBoard > Instructor Dashboard.
Uses for Faculty
There are multiple ways to use IntelliBoard based on report type. Some of our favorites are:
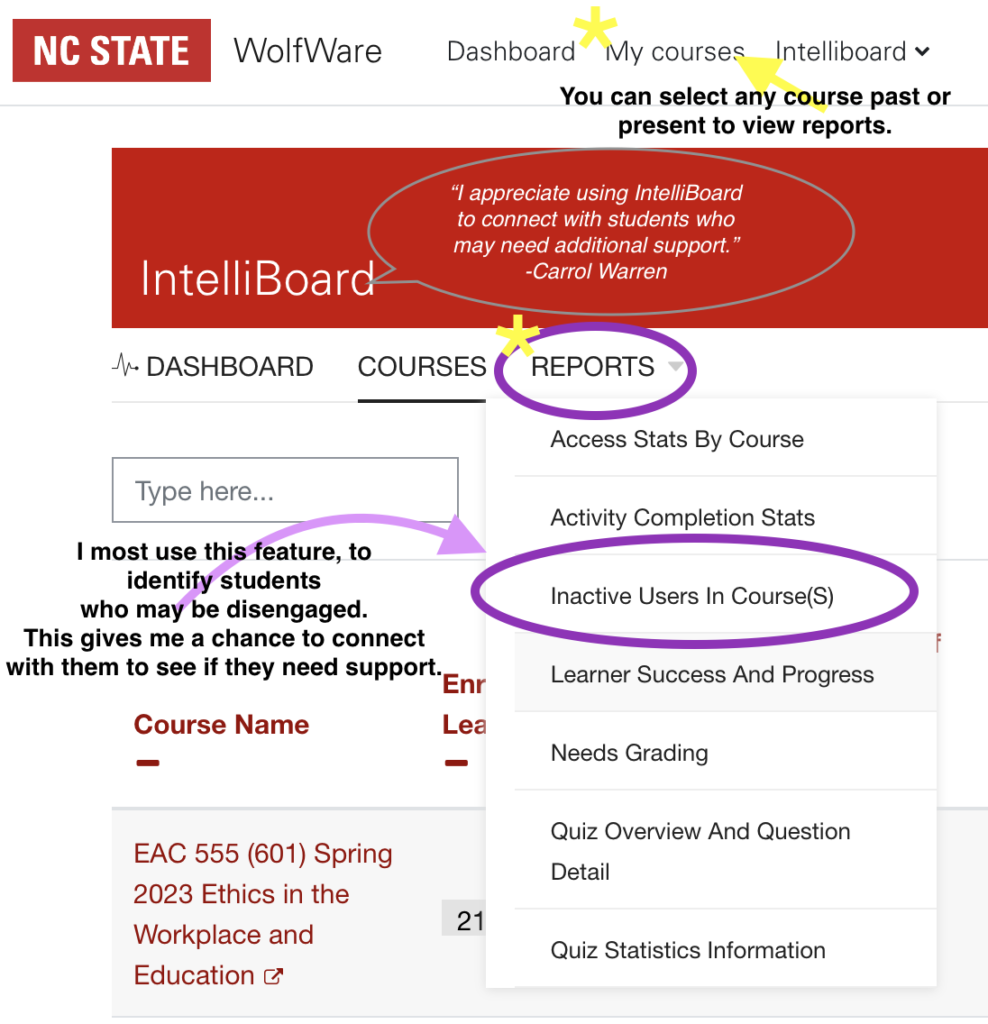
- Inactive Users in Course
- Displays students who have not logged in within a selected number of days
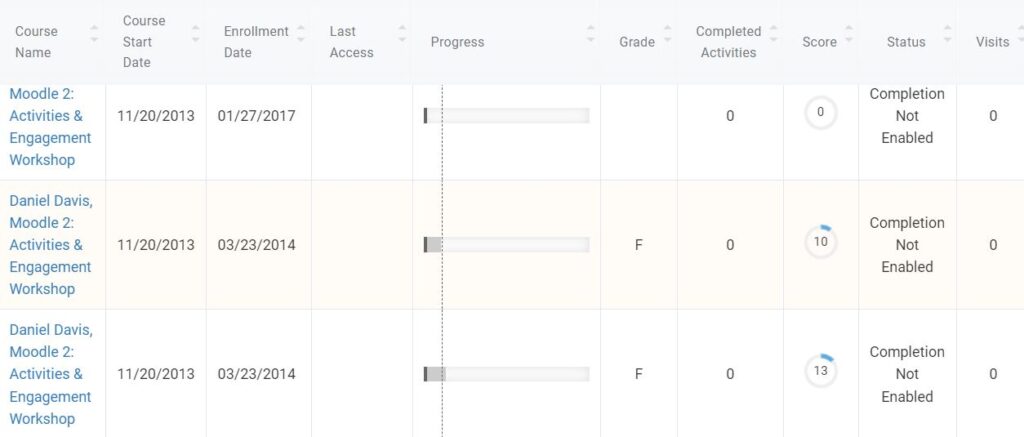
- Learner Success and Progress
- Displays students’ current course grade compared to the course average, as well as the number of completed activities and visits to Moodle
- Quiz Overview and Question Detail
- Displays statistics from each quiz including correct/incorrect answers and quiz completion date/time
What Faculty Fellows are Saying
DELTA Faculty Fellows using IntelliBoard this semester have had positive experiences.
- Assistant Teaching Professor Claire Gordy finds the tool helpful for identifying students before they fall behind in her asynchronous class.
- Assistant Teaching Professor Sarah Egan Warren enjoys visualizing grades and student outcomes. She says, “IntelliBoard helps you see trends and the big picture. The Learner Success and Progress report lets you easily view and sort grades, time spent, and completed activities all at once. This report could be helpful if meeting with a struggling student to provide specific data about performance. For example, showing the time spent or the number of visits and how the lower these are, often the lower the grade. The Quiz Overview and Question Detail report provides great information about the highest and lowest grades and shows which questions could be the most challenging or possibly problematic in the Question Breakdown. Plus, the instructor is able to drill down to the student level for the details about the answers.”
- Assistant Teaching Professor Carrol Warren appreciates the Inactive Users report, noting that it helps her identify students who may be disengaged.
- Associate Teaching Professor Bevin Maultsby utilizes two reports on a weekly basis. She says, “One is Learner Success and Progress, which provides a nice snapshot of student engagement and makes it clear which students might be falling behind. The other is Needs Grading, which reminds me of Moodle assignments or quiz essay questions I haven’t looked at yet.”