Have You Seen Your Video Stats?
Are you flipping your class? Teaching online? Putting additional resources online?
As we use video more and more to supplement and drive our courses, tools that allow us to see what our students are watching–and if they’re watching–can help us in making our classes more effective and improving learning outcomes. With the powerful tools built into Mediasite’s software, instructors and instructional designers can see patterns in students’ viewing and online behavior. With this information, instructors can better discern how students’ viewing patterns correlate to learning outcomes, program and lecture effectiveness, and student engagement and individual performance.
Below is an example Mediasite analytics report, which uses intensity maps to indicate the most-watched presentation segments. Instructors can also dig deeper into the report to view activity from individual users.
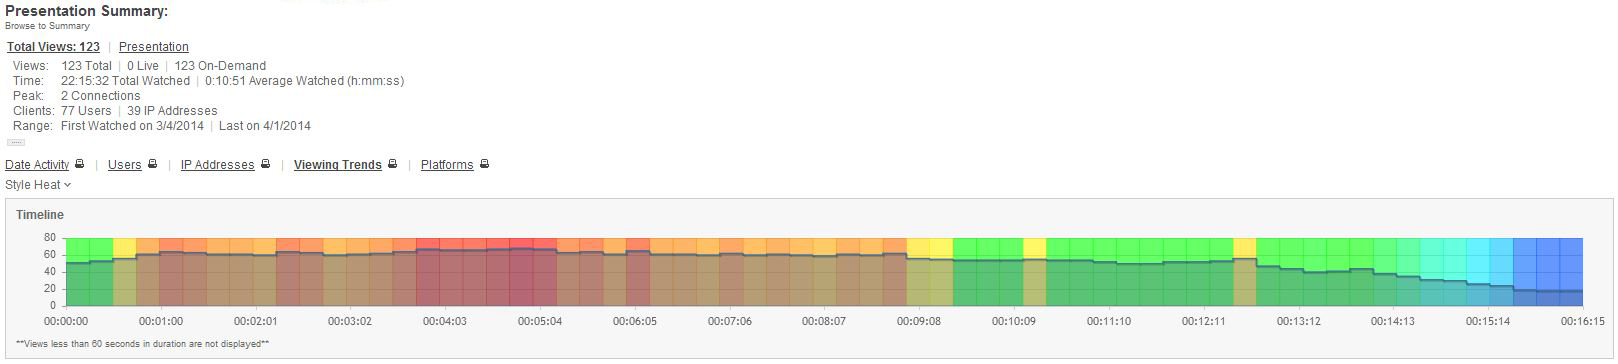
This trend chart uses intensity maps to show how views correspond to time-keyed portions of the lecture.
Instructors can view statistics for live and on-demand views, average viewings per presentation, most watched presentations and most active users. A better understanding of these data can help answer questions such as:
- Are students actually watching the lectures, and are they viewing assigned lectures on the appropriate dates?
- How thoroughly are students watching the videos?
- At what point in a video, if any, do viewers tend to stop watching?
- Are students re-watching certain portions of the videos?
- Are some students not following the course material (allowing instructors to identify students potentially at risk)?
- At what points are students particularly interested or not interested?
Because these data reveal who watches the recordings and where the frequently re-watched video “hotspots” occur, instructors can better anticipate concepts that need additional review and see areas for improvement in future recordings.
These data can also help instructors and instructional designers make lectures and content more effective in the next course redesign cycle.
How do I receive these reports?
- If you use the desktop recorder and manage your content through the My Mediasite portal, you can access analytics by clicking on the analytics icon beneath a presentation thumbnail in the presentation management window.
- If you record content in a classroom on campus, or if you wish to receive a summarized report of all content in your My Mediasite folder, you can opt to receive recurring reports via email that the Mediasite Server runs at specified intervals. To receive these automated reports, please email mediasite-help@ncsu.edu.
- Categories: